Stay in the Know - Subscribe to Our Newsletters
Join a network of more than 90,000 waste and recycling industry professionals. Get the latest news and insights straight to your inbox. Free.
How do states achieve high diversion rates?
November 1, 2010

Robin Mitchell
Prompted by Florida's 75 percent recycling goal, Kessler Consulting Inc. (KCI) set out to answer the question: "What set of state-level policies and programs are needed to maximize recycling?"
After researching various "high-performing" states (i.e., those reporting recycling or waste diversion rates of 40 percent or higher), KCI identified 10 key elements that contributed to their success (see Figure 1). Part 1 of this article ("The Recycling Roadmap," Waste Age, October 2010) discussed the first five elements, which are policy-related. This article focuses on the remaining five, which are more programmatic in nature.
Figure 1: Key Policy and Programmatic Drivers of Successful Recycling |
|---|
|
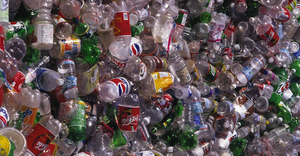
KCI first looked at what makes up Florida's waste stream (see Figure 2), which is similar to that of most other states. Recycling 75 percent of the more than 30 million tons of municipal solid waste generated annually in Florida will require substantial increases in the recovery of paper, construction and demolition debris (C&D), and organics. Funding will be needed to expand the collection and processing infrastructure, and markets for this additional tonnage will need to be identified or developed.
Figure 2: Composition of MSW in Florida, 2008 (% by weight) | |
|---|---|
Newspaper | 5% |
Corrugated Paper | 8% |
Other Recyclable Paper | 10% |
Containers | 6% |
C&D Debris | 24% |
Scrap Metals | 13% |
Yard Trash | 11% |
Food Waste | 6% |
Other Materials | 17% |
Source: Florida Department of Environmental Protectiioon |
Many of the states with high diversion rates have realized the critical role that C&D waste plays in achieving their goals, and have initiated programs to encourage or require its recovery. Mechanisms that help drive C&D recycling generally fall into one of three categories: education/technical assistance, economic incentives or regulations (see Figure 3).
Historically, state and local governments have sought to stimulate voluntary C&D recycling by employing education and market incentives before adopting regulatory controls. Massachusetts is one state that has taken a regulatory approach by banning the disposal of asphalt pavement, brick, concrete, metal and wood. In 2006, the year the bans took effect, Massachusetts reported that 66 percent of its C&D debris was recycled.
Figure 3: Tools to Increase C&D Debris Recycling |
|---|
EDUCATION/ASSISTANCE
|
ECONOMIC INCENTIVES
|
REGULATIONS
|
Substantial recovery rates for organics have been achieved by applying a myriad of policies and programs, and by targeting food waste in addition to yard trash. Examples include:
Disposal bans. Twenty-three states have some form of yard trash disposal ban, and at least one state (Massachusetts) has considered a ban on food waste.
Regulations that streamline permitting of composting facilities.
State Department of Transportation (DOT) programs to use compost and mulch. At least 30 state DOTs have compost or related product specifications for roadside maintenance and erosion control projects.
Quality standards for finished compost to ensure users they are purchasing high-quality products. Several states have adopted the U.S. Composting Council's Seal of Quality Assurance for compost and mulch.
Development of on-farm composting.
Research and demonstration projects, training and grants.
One of the most promising approaches is establishing programs that link water quality and resource protection with soil quality and compost use. For example, Washington established best management practices for stormwater management that requires new construction projects to amend soil with compost to protect local waterways.
Organics are a major source of methane emissions from landfills. Much of this methane is generated and released to the atmosphere before landfill cells are closed and gas recovery systems installed. Therefore, diverting organics from disposal is especially beneficial in reducing greenhouse gas emissions.
Merely collecting recyclables is of no use unless there are markets to use these materials. States can be a driver in creating demand for recycled-content products by requiring the purchase of such products and establishing environmentally preferable purchasing programs.
Some states have partnered with economic development agencies to promote the development of in-state recycling markets. Economic incentives can take the form of low-interest loans, grants or tax exemptions for processors or manufacturers using recovered materials. Other assistance can range from business plan development to expedited permitting to help with sourcing materials. Establishing domestic markets not only provides local outlets for recovered commodities, but also creates jobs and spurs economic growth.
As markets for traditional recyclable commodities expanded in both the United States and overseas, states seeking to attain higher recycling rates have shifted their market development efforts to a new set of priority materials (see Figure 4).
Figure 4: Common Market Development Priorities |
|---|
Top-Tier Priorities
|
Second-Tier Priorities
|
Most of the leading recycling states provide practical and ongoing technical assistance to local governments, and help them stay current on advancements in recycling program design and technologies. In the last 10 years, technologies have emerged that improve collection and processing efficiency. In addition, innovative and streamlined program designs can add convenience and create incentives for recycling participation. Some of the key programs being promoted include:
Pay-As-You-Throw.
Single-stream recycling.
Commercial recycling mandates and incentives.
Food waste recovery.
Mixed waste processing.
Funding is critical to the development of the programs and infrastructure necessary to achieve high recycling rates. States use a variety of funding sources, but share a common challenge of ensuring that the funds are used for their intended purpose and not raided to make up for other budgetary shortfalls. The most common funding mechanisms are:
Disposal fees and surcharges. At least 30 states levy a fee on waste delivered to disposal facilities and/or transfer stations.
Facility permit fees.
Unredeemed deposits from bottle bills.
Advance recovery fees.
Special fees and taxes.
Product stewardship fees.
Appropriations from state general funds.
Achieving a recycling rate of 75 percent requires a fundamental shift from a philosophy of "waste management" to "resource management". It requires increased public and private sector investment in the recovery and processing infrastructure, an expansion of markets, and influencing product and packaging design to enhance the recyclability of more materials.
Maximizing recycling is not a journey for the faint-hearted, and there is no one-size-fits-all approach. To get there, you must have a plan, target the largest waste categories (e.g. paper, C&D and organics) and ensure that markets exist to absorb those commodities. The chosen route may vary but you will need a political champion to pave the way and the resources to see you through to your destination. You need to be equipped with the right set of tools and have an experienced guide committed to reaching the desired goal.
Read "The Recycling Roadmap," part one of this article, to learn about five important policy tools that have been used by states with recycling rates of 40 percent or higher.
Robin Mitchell is a Project Manager and Senior Consultant at Kessler Consulting, Inc., a national solid waste consulting firm based in Tampa, Florida. She can be contacted at [email protected] or 813-971-8333.
You May Also Like